
Alert Center
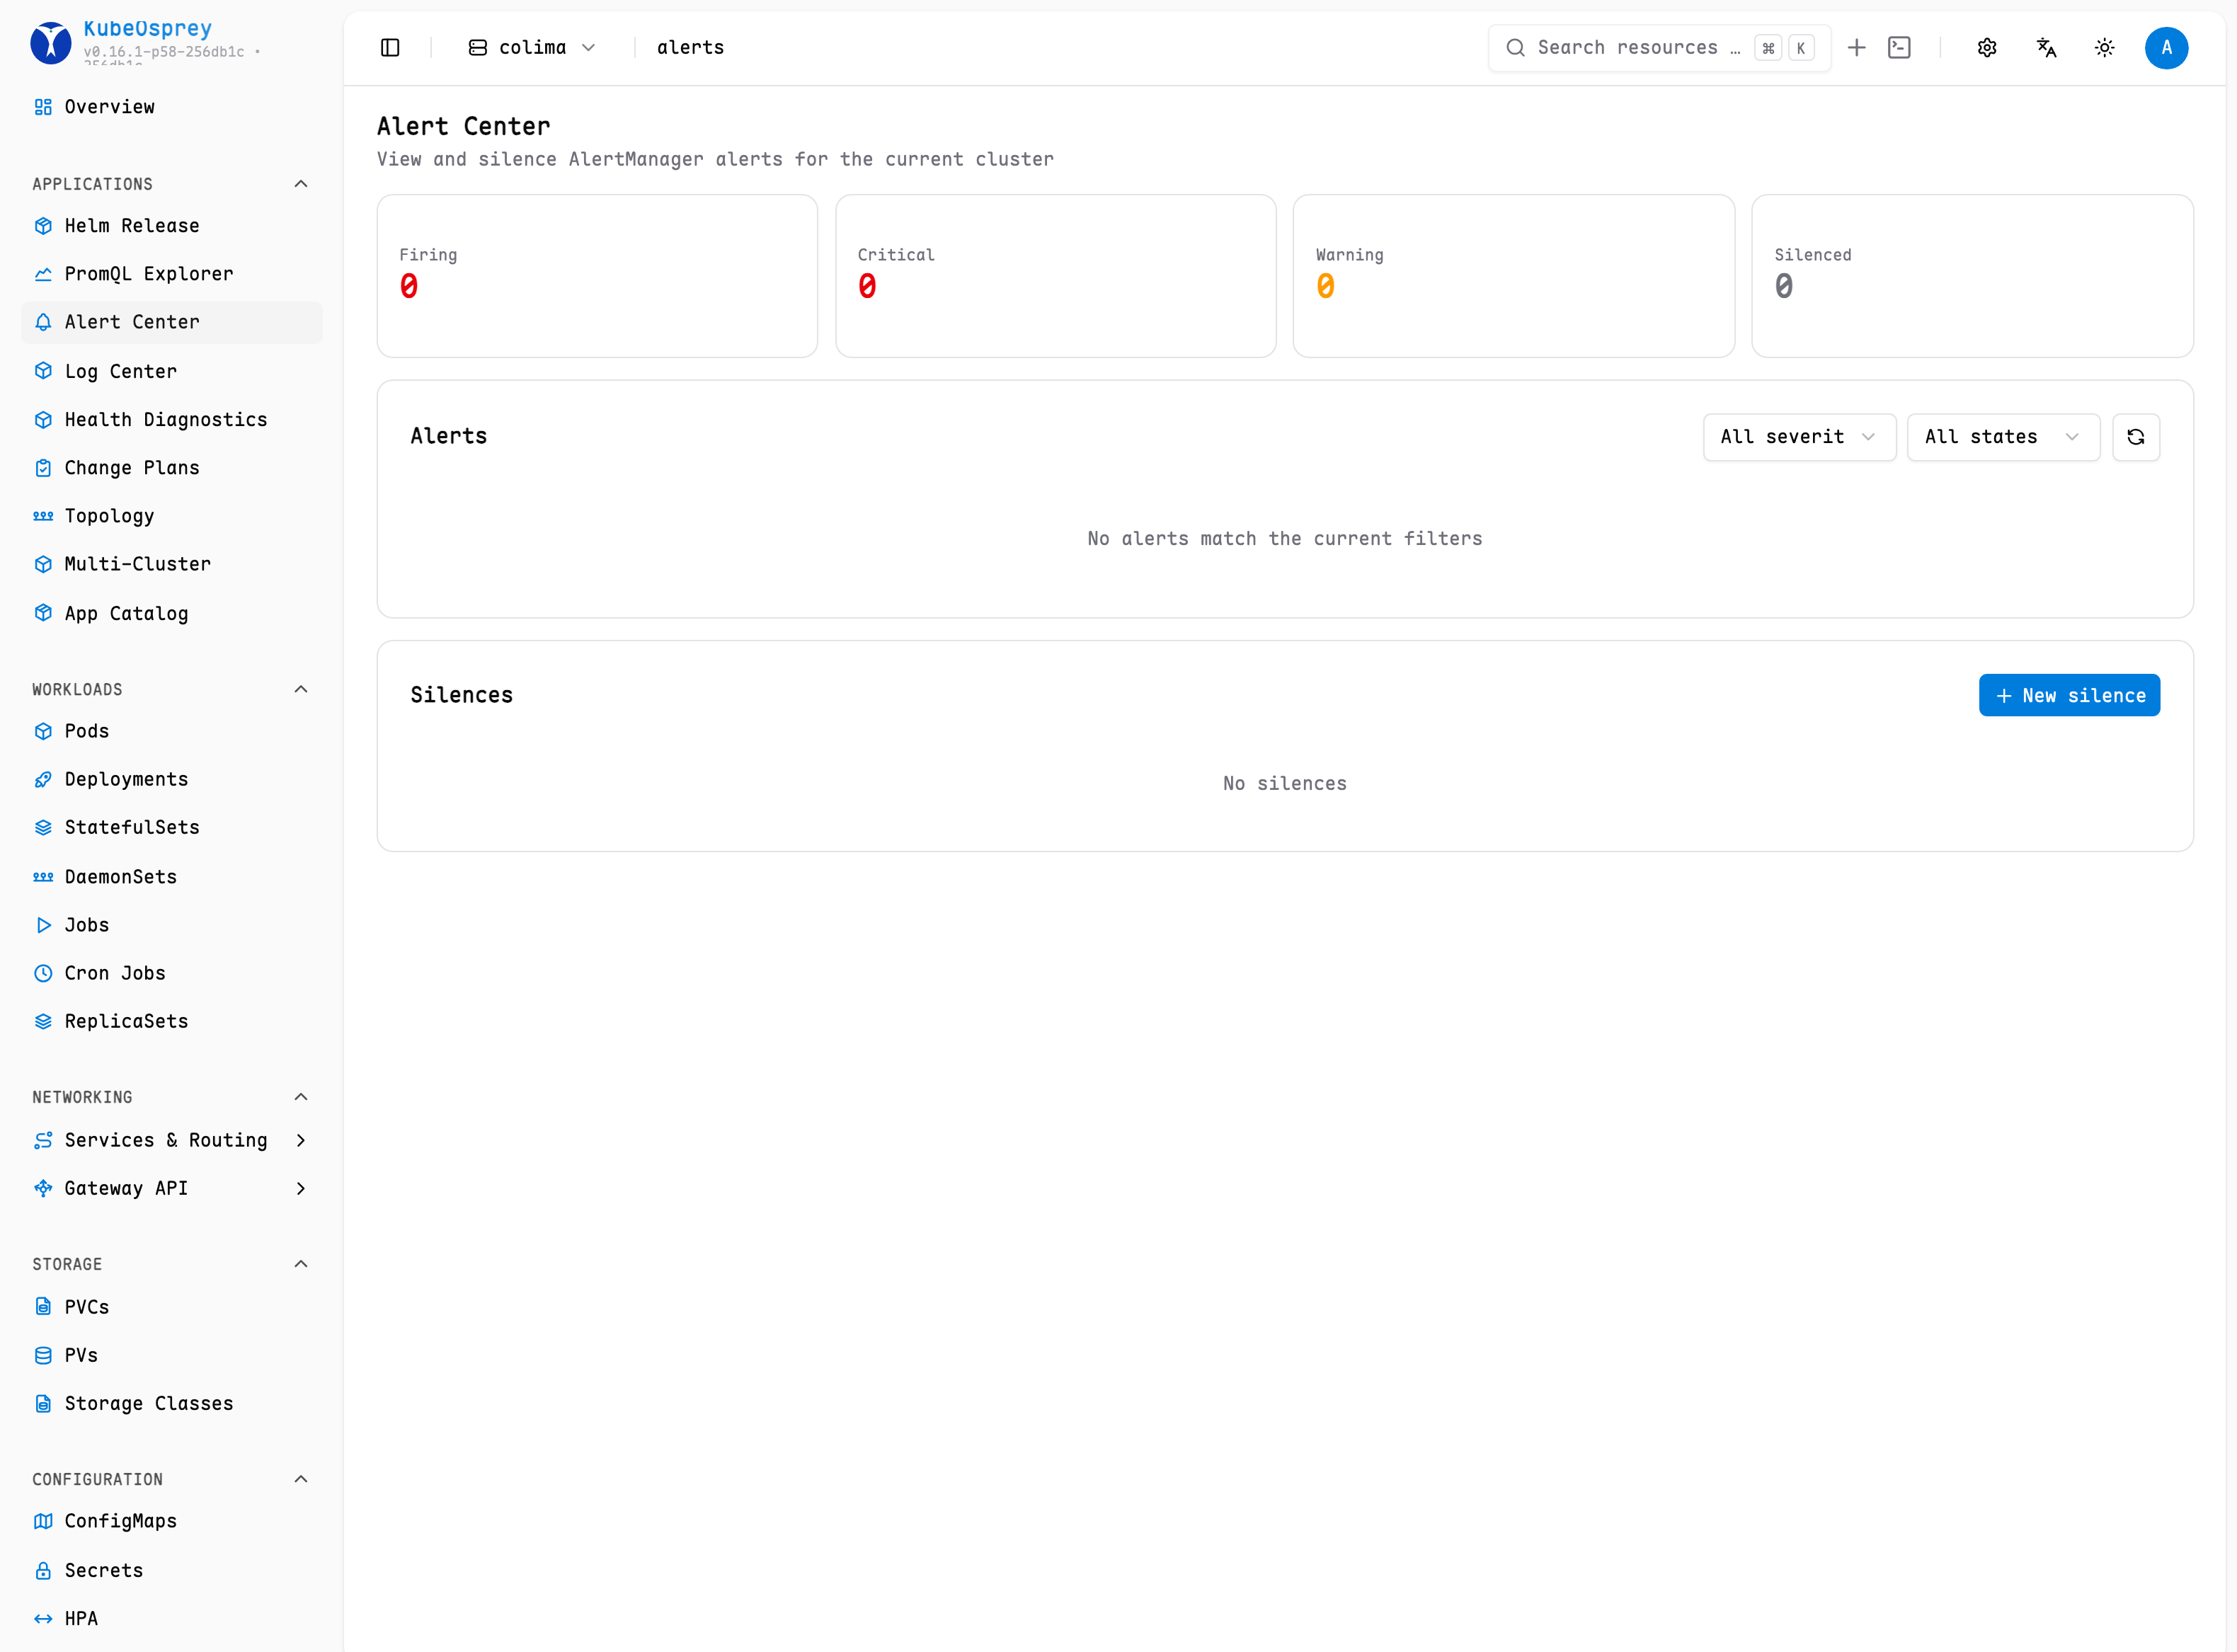
The Alert Center gives you a unified view of the alerts fired by Alertmanager in each cluster, together with silence management, directly inside KubeOsprey.
Prerequisites
- Prometheus monitoring must be configured for the cluster. See the Prometheus Setup Guide.
- An Alertmanager endpoint must be reachable for the cluster. KubeOsprey auto-discovers an Alertmanager service in the cluster when one runs with the standard
kube-prometheus-stacklabels; you can also set the URL explicitly in the cluster settings.
What you can do
- View alerts with their labels, annotations, severity, and firing duration.
- Create silences for an alert to stop notifications for a period of time.
- List and expire silences when an outage window is over.
- Check Alertmanager status to confirm the integration is healthy.
Access follows the cluster's RBAC: a user who cannot access the cluster cannot see its alerts.
API
The Alert Center is backed by the following cluster-scoped endpoints:
| Method | Path | Purpose |
|---|---|---|
GET | /api/v1/alertmanager/alerts | List active alerts |
GET | /api/v1/alertmanager/silences | List silences |
POST | /api/v1/alertmanager/silences | Create a silence |
DELETE | /api/v1/alertmanager/silences/:silenceId | Expire a silence |
GET | /api/v1/alertmanager/status | Alertmanager status |
Related reading
Pair the Alert Center with Health Diagnostics for a complete picture: diagnostics tells you what is degrading inside the cluster, alerts tell you what your monitoring already noticed.