
Health Diagnostics
Health Diagnostics runs a set of built-in checks against a cluster and turns the results into a single health score with actionable findings. It answers the question "is this cluster healthy right now?" without writing your own queries.
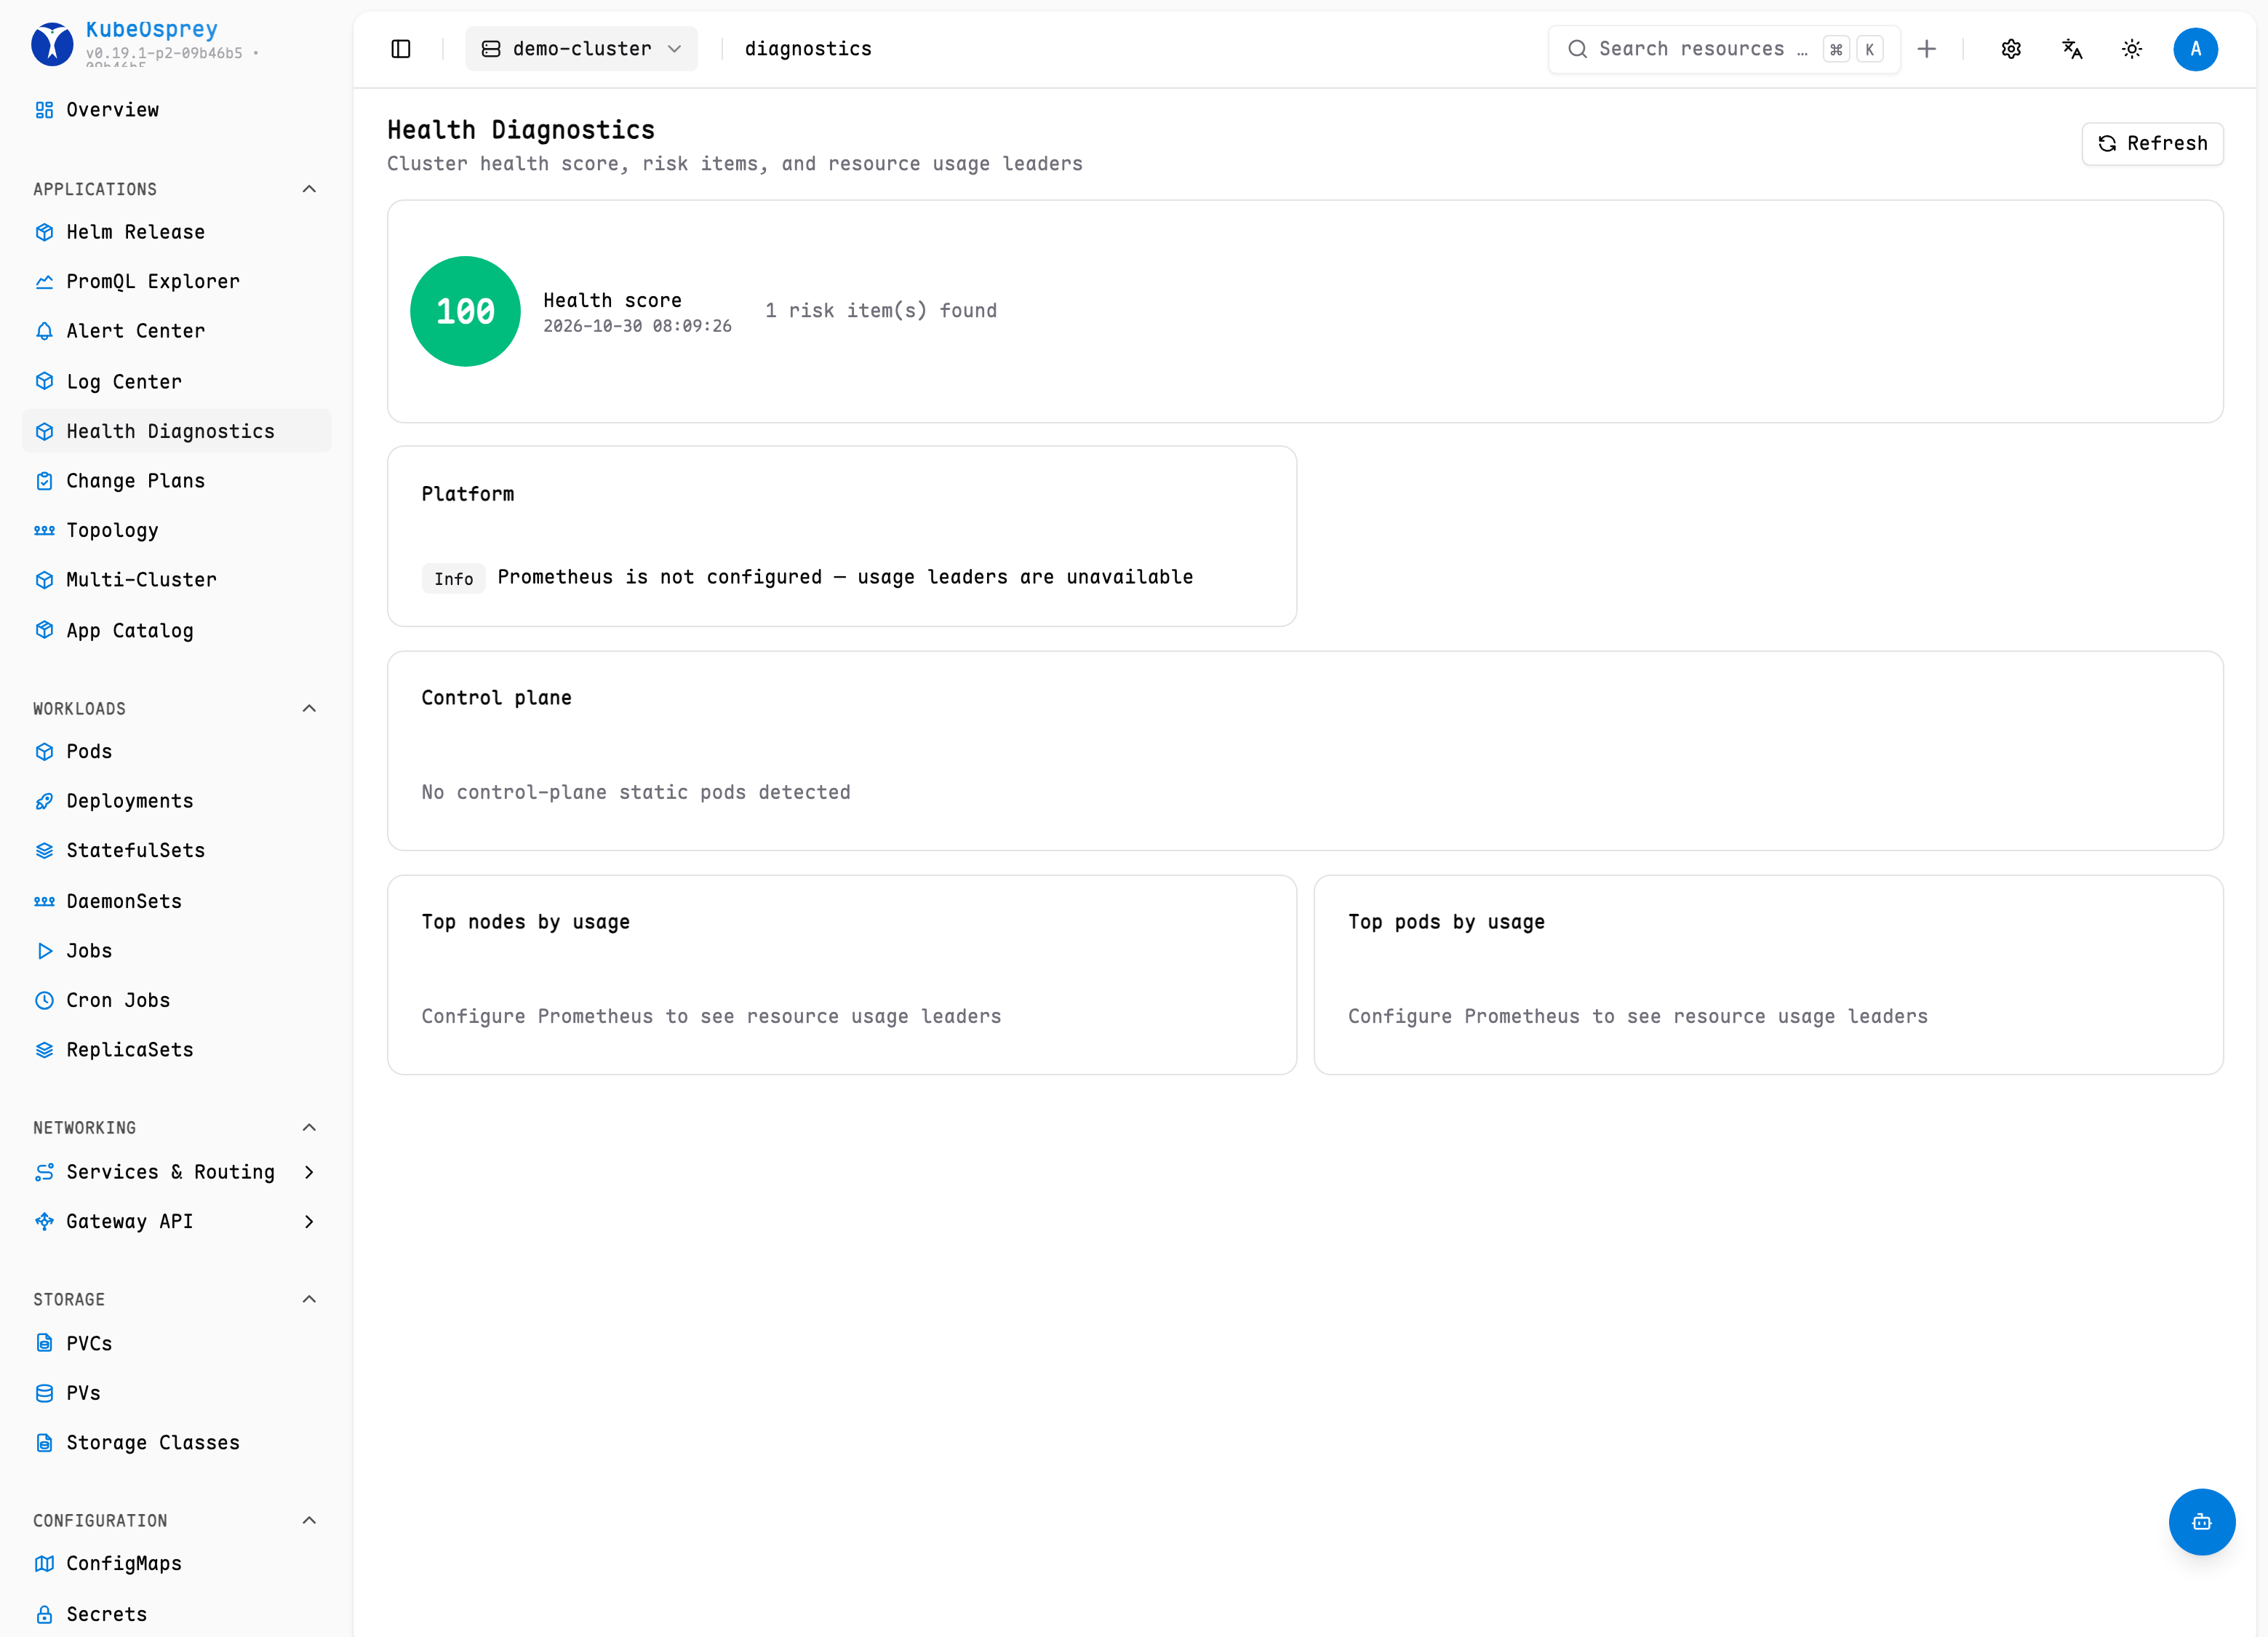
What the report contains
- Health score — an overall 0–100 score derived from the check results.
- Findings — grouped into four categories, each with a severity (
critical,warning,info), an occurrence count, and a sample:nodes— NotReady nodes, resource pressure, and similar node-level issues.workloads— failing or restarted pods, unavailable replicas.storage— PVC binding and capacity problems.platform— control plane and add-on health.
- Control plane components — ready/total counts for API server, scheduler, controller manager, and etcd.
- Top consumers — nodes and pods with the highest CPU and memory usage. This section is only shown when Prometheus is enabled for the cluster.
Multi-cluster overview
The overview page aggregates the health of all clusters you can access, so you can spot the unhealthy cluster in a fleet at a glance.
API
| Method | Path | Purpose |
|---|---|---|
GET | /api/v1/health-report | Health report for one cluster |
GET | /api/v1/clusters/overview | Aggregated multi-cluster overview |
TIP
Health checks are computed on request, not stored — every page load reflects the current state of the cluster.